UI
Grafana - TS + Go
https://github.com/grafana/grafana
- Search dashboards & copy ID to /dashboard/import: https://grafana.com/grafana/dashboards/
-
[auth.anonymous] enabled = true org_name = Main Org. org_role = Viewer hide_version = true # default: false
Monitoring
https://en.wikipedia.org/wiki/Comparison_of_network_monitoring_systems
Prometheus - Go + TS
https://github.com/prometheus/prometheus
Grafana: https://grafana.com/grafana/dashboards/1860-node-exporter-full/ | {url}?var-node=
InfluxDB Telegraf
Grafana Promtail
agent : local logs -> loki : https://grafana.com/docs/loki/latest/clients/promtail/
Zabbix - C/PHP/JAVA
https://github.com/zabbix/zabbix
server - Docker
https://www.zabbix.com/documentation/4.0/manual/installation/containers
docker run --name zabbix-appliance -t \
    -p 10051:10051 \
    -p 8083:80 \
    -d zabbix/zabbix-appliance:latest
# Default login: Admin/zabbix
agent
Active : zabbix_agentd: active checks ->  zabbix_server: trapper  :10051
    ServerActive=

Passive: zabbix_server: poller        ->  zabbix_agentd: listener :10050\
    Server=

# Windows agent, run under admininstrator cmd
zabbix_agentd.exe --config zabbix_agentd.win.conf --install

# Debian/Ubuntu
apt install zabbix-agent
service zabbix-agent start
Nagios - C
https://github.com/NagiosEnterprises/nagioscore
https://github.com/centreon/centreon
https://github.com/NagVis/nagvis
Docker
https://hub.docker.com/r/jasonrivers/nagios/
docker run --name nagios4 --rm -it -p 0.0.0.0:8082:80 jasonrivers/nagios:latest

docker cp nagios4:/opt/nagios/etc ./nagios/etc
docker cp nagios4:/opt/nagios/var ./nagios/var
docker cp nagios4:/opt/nagiosgraph/etc ./nagios/graph_etc
docker cp nagios4:/opt/nagiosgraph/var ./nagios/graph_var

docker run --name nagios4  \
-d --restart unless-stopped \
-v $PWD/nagios/etc/:/opt/nagios/etc/ \
-v $PWD/nagios/var:/opt/nagios/var/ \
-v $PWD/nagios/graph_etc:/opt/nagiosgraph/etc \
-v $PWD/nagios/graph_var:/opt/nagiosgraph/var \
-v $PWD/nagios/custom-plugins:/opt/Custom-Nagios-Plugins \
-p 8082:80 jasonrivers/nagios:latest

docker exec -it nagios4 htpasswd /opt/nagios/etc/htpasswd.users nagiosadmin
docker exec -it nagios4 cat /opt/nagios/etc/objects/contacts.cfg
docker exec -it nagios4 grep ^cfg_ /opt/nagios/etc/nagios.cfg
docker restart nagios4 && docker logs nagios4

# nrpe
NAGIOS_SERVER=1.2.3.4
docker run -d --restart unless-stopped \
    -v /:/rootfs:ro -v /var/run:/var/run:rw -v /sys:/sys:ro \
    -v /var/lib/docker/:/var/lib/docker:ro \
    --privileged --net=host --ipc=host --pid=host \
    -e NAGIOS_SERVER="$NAGIOS_SERVER" \
    --name nagios_nrpe \
    mikenowak/nrpe
Elastic
Beats - Go
https://www.elastic.co/products/beats
https://github.com/elastic/beats
Filebeat    Log Files Beats
Metricbeat  Metrics Beats
Packetbeat  Network Data Beats
Winlogbeat  Windows Event Logs Beats
Auditbeat   Audit Data Beats
Heartbeat   Uptime Monitoring
Cacti - PHP
https://github.com/Cacti/cacti
https://hub.docker.com/r/smcline06/cacti
docker pull smcline06/cacti:latest
alert
https://github.com/Yelp/elastalert https://github.com/sirensolutions/sentinl
https://sematext.com/blog/x-pack-alternatives/
TICK stack
https://gist.github.com/travisjeffery/43f424fbd7ac677adbba304cef6eb58f
| Component | Role |
|---|---|
| Telegraf | Data collector |
| InfluxDB | Stores data |
| Chronograf | Visualizer |
| Kapacitor | Alerter |
Pandora FMS - PHP/Perl
https://github.com/pandorafms/pandorafms#screenshots
# Auto docker
curl -sSL http://pandorafms.org/getpandora  | sh  # Auto, or manually below

# Manually
docker run \
    --name pandora-mysql \
    -e MYSQL_ROOT_PASSWORD=AVeryStrongRootPassword \
    -e MYSQL_DATABASE=pandora \
    -e MYSQL_USER=pandora \
    -e MYSQL_PASSWORD=pandora
    -d pandorafms/pandorafms-mysql:6

docker run -p 41121:41121 \
    --link pandora-mysql:mysql \
    -d pandorafms/pandorafms-server:6

docker run \
    -p 80:80 -p 8022:8022 -p 8023:8023 \
    --link pandora-mysql:mysql \
    -d pandorafms/pandorafms-console:6

apt install -y pandorafms-agent
open-falcon - Go + Python Flask
https://github.com/open-falcon/falcon-plus/tree/master/docker
v0.3: May 30, 2019
https://github.com/open-falcon/falcon-plus/blob/master/docker/README.md
Munin - Perl/Shell
networked resource monitoring tool
http://munin-monitoring.org/
http://guide.munin-monitoring.org/en/latest/tutorial/index.html
netdata - C/Python/JS/Shell
https://github.com/firehol/netdata (with screenshots)
https://github.com/firehol/netdata/wiki/Installation
bash <(curl -Ss https://my-netdata.io/kickstart-static64.sh)
Management
Fabric - Python library
https://github.com/fabric/fabric
Fabric is a high level Python (2.7, 3.4+) library designed to execute shell commands remotely over SSH, yielding useful Python objects in return.
Fabric (1.x and earlier) was a hybrid project implementing two feature sets: task execution (organization of task functions, execution of them via CLI, and local shell commands) and high level SSH actions (organization of servers/hosts, remote shell commands, and file transfer).
invoke - Python library
https://github.com/pyinvoke/invoke
When planning Fabric 2.x, having the “local” feature set as a standalone library made sense, and it seemed plausible to design the SSH component as a separate layer above. Thus, Invoke was created to focus exclusively on local and abstract concerns, leaving Fabric 2.x concerned only with servers and network commands.
Terraform
- https://github.com/hashicorp/terraform
- Self Managed, always free: https://developer.hashicorp.com/terraform/downloads
Ansible - Python
https://github.com/fzinfz/ansible
Puppet - Ruby
https://hub.docker.com/u/puppet/
https://puppet.com/products/why-puppet/puppet-enterprise-and-open-source-puppet
Chef - Ruby
https://hub.docker.com/r/chef/chef/
SaltStack - Python
https://github.com/saltstack/salt
https://hub.docker.com/r/saltstack/
Agentless: https://docs.saltstack.com/en/latest/topics/ssh/index.html
CI
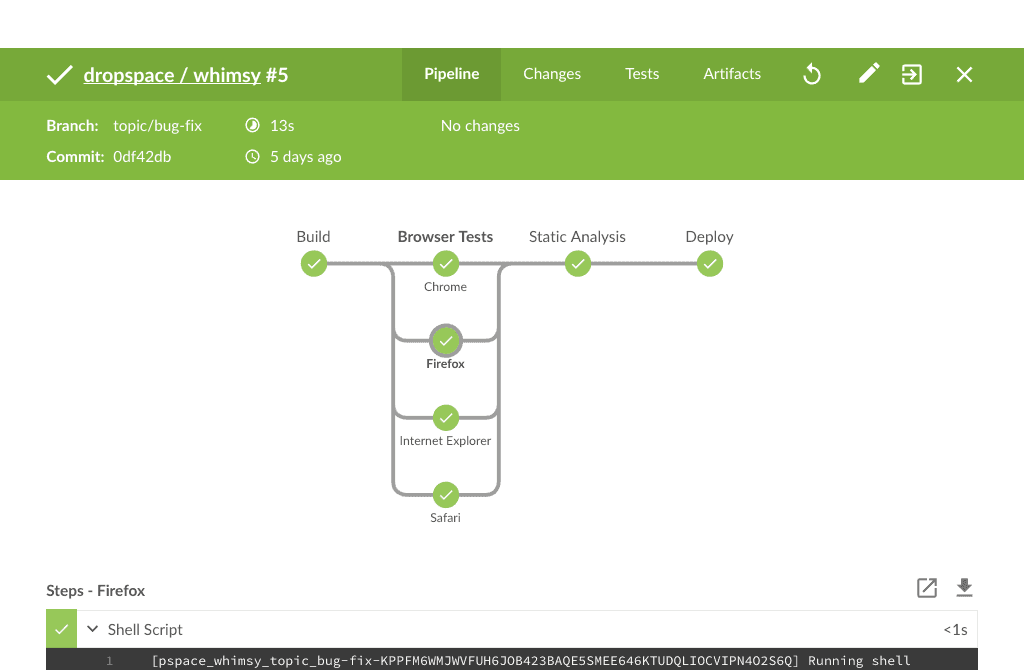
Jenkins - JAVA
https://github.com/jenkinsci/jenkins 
https://github.com/jenkinsci/docker/blob/master/README.md#usage
docker run -d -p 8089:8080 -p 50000:50000 jenkins/jenkins:lts
docker exec jenkins cat /var/jenkins_home/secrets/initialAdminPassword

docker run jenkins/jnlp-slave -url http://jenkins-server:port <secret> <agent name>
https://wiki.jenkins.io/pages/viewpage.action?pageId=75893612
Open a browser on the slave machine and go to the Jenkins master server url (http://yourjenkinsmaster:8080).
Go to Manage Jenkins > Manage Nodes, Click on the newly created slave machine. You will need to login as someone that has the "Connect" Slave permission if you have configured global security.
Click on the Launch button to launch agent from browser on slave.
run on all nodes: elastic-axis
Travis - Ruby/JS
https://github.com/travis-ci/travis-ci
SNMP
https://en.wikipedia.org/wiki/Simple_Network_Management_Protocol
v1: Authentication of clients is performed only by a “community string”, in effect a type of password, which is transmitted in cleartext.
v2c comprises SNMPv2 without the controversial new SNMP v2 security model, using instead the simple community-based security scheme of SNMPv1. incompatible with SNMPv1 in two key areas: message formats and protocol operations.
v2u: greater security than SNMPv1, but without incurring the high complexity of SNMPv2.
v3 primarily added security and remote configuration enhancements to SNMP.
the agent connects to the server on port 162
port 161 on the agent side is used for queries
More
https://github.com/bregman-arie/devops-resources#devops-tooling
